Top_Switch is a rule-based, regime-switching strategy that dynamically rotates between a risk-seeking and a risk-defensive allocation depending on short-term stress conditions in the market. The objective is to participate in equity upside during normal environments while automatically shifting to a more defensive posture when risk increases.
- Capital is rotated between asset classes based on systematic signals
- Exposure shifts as market leadership and conditions change
- All allocation decisions follow predefined, rule-based processes
Top_Research represents the complete universe of rule-based trading strategies, which are systematically implemented within the GR_Strategies portfolios in both USD and EUR.
| Date | Top_Switch | DAX | SP500 |
|---|---|---|---|
| 1.76 % | 0.54 % | ||
| -1.87 % | -1.95 % | ||
| 0.59 % | 9.07 % | ||
| 76.93 % | 102.32 % | ||
| 17.53 % | 22.08 % | ||
| 1.17 | 1.48 |
Core concept
The strategy maintains two internally
risk-balanced portfolios and selects between them based on systematic
stress signals. This binary switching mechanism allows the portfolio to
react quickly to changes in market conditions without relying on
forecasts or discretionary decisions.
Risk-seeking allocation
In stable market
environments, the strategy allocates to a growth-oriented basket
designed to benefit from rising equity markets. Position sizes within
this sleeve are adjusted using a risk-balancing framework to prevent
concentration in any single component.
Risk-defensive allocation
When stress indicators
signal increased uncertainty, the strategy shifts into a more defensive
allocation that emphasizes diversification and capital preservation.
This allocation is constructed using the same risk-balancing principles
to maintain consistency across regimes.
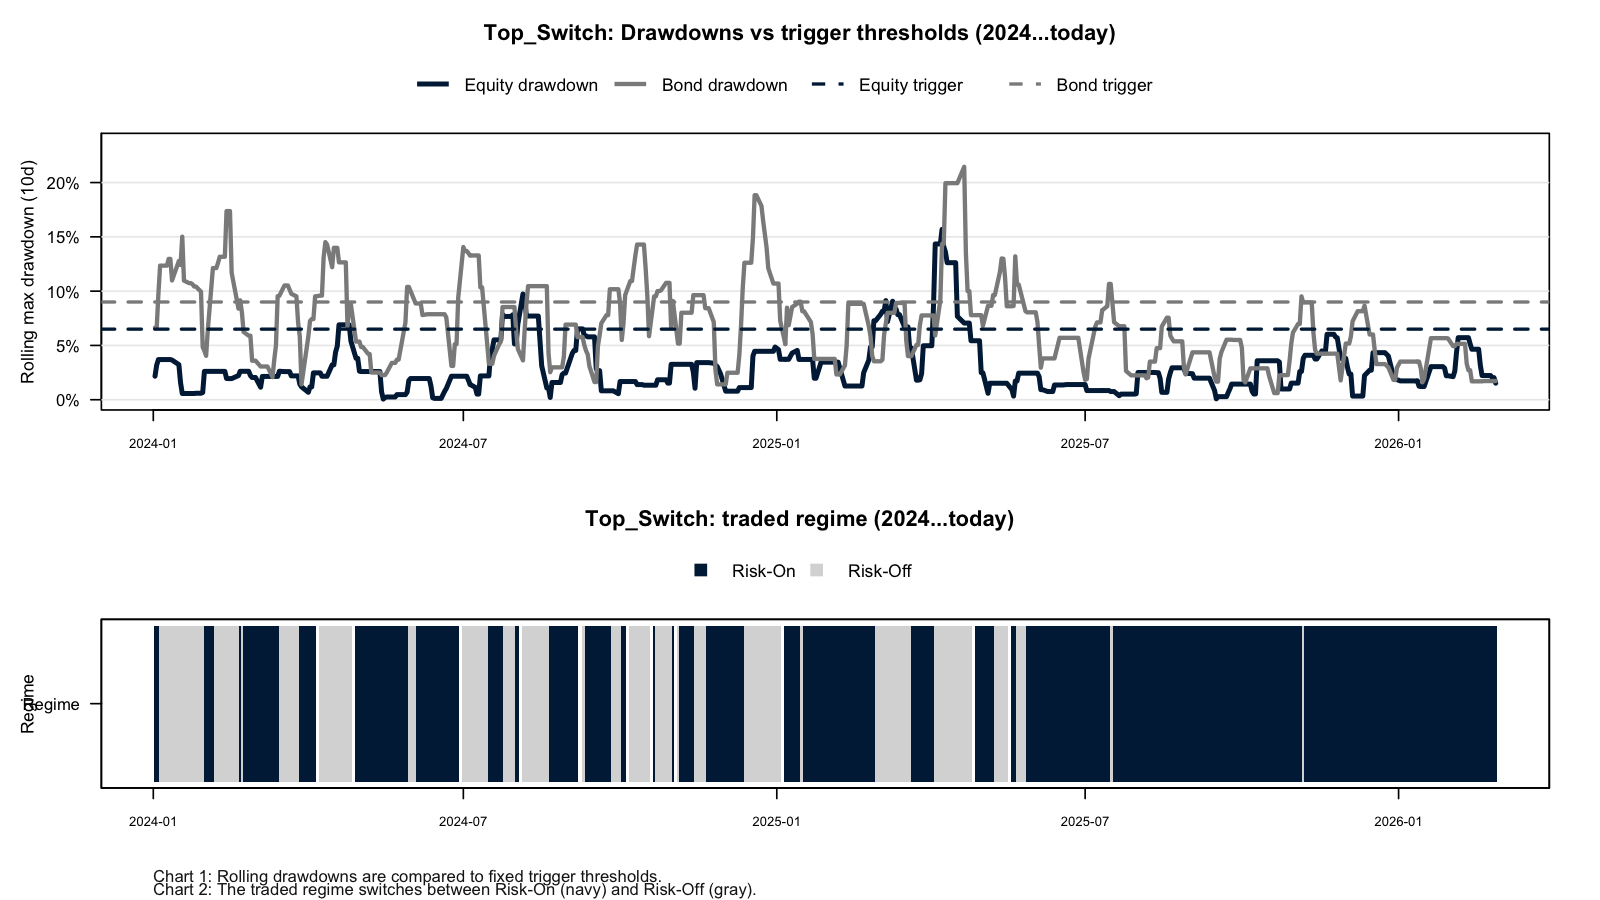
Switch mechanism
The transition between
risk-seeking and defensive modes is driven by short-term stress
indicators derived from market behavior. All signals are applied with
appropriate safeguards to ensure robustness and avoid reacting to market
noise.
Objective
Top_Switch aims to combine upside
participation with systematic downside protection by explicitly
switching portfolio regimes. By coupling a transparent stress-detection
framework with disciplined risk balancing, the strategy seeks to remain
adaptive across changing market environments.

| Top_Switch: 68.60 % |
| Jan | Feb | Mar | Apr | May | Jun | Jul | Aug | Sep | Oct | Nov | Dec | Year | |
|---|---|---|---|---|---|---|---|---|---|---|---|---|---|
| 2023 | |||||||||||||
| 2024 | |||||||||||||
| 2025 | |||||||||||||
| 2026 |
Performance Metrics
| Top_Switch | |
|---|---|
| Cumulative Return (%) | 68.60 |
| Ann. Return (%) | 16.46 |
| Ann. Sharpe Ratio | 0.67 |
| MAR Ratio | 0.68 |
Risk Metrics
| Top_Switch | |
|---|---|
| Ann. StdDev. (%) | 24.70 |
| SemiDeviation (%) | 1.13 |
| Max DrawDown (%) | 24.23 |
| Value-at-Risk (%) | -2.53 |
Daily Metrics
| daily metrics (%) | |
|---|---|
| Av. Return (%) | 0.07 |
| Best Day (%) | 6.44 |
| Worst Day (%) | -8.17 |
| Av. Up-Day (%) | 1.06 |
| Av. Down-Day (%) | -1.16 |
| Pct Up-Days (%) | 55.00 |
| Pct Down-Days (%) | 44.00 |
Monthly Metrics
| monthly metrics (%) | |
|---|---|
| Av. Return (%) | 1.21 |
| Best Month (%) | 28.90 |
| Worst Month (%) | -15.62 |
| Av. Up-Month (%) | 7.53 |
| Av. Down-Month (%) | -4.24 |
| Pct Up-Months (%) | 46.00 |
| Pct Down-Months (%) | 54.00 |
| From | Trough | To / Recovery | Depth | Days |
|---|---|---|---|---|
| 2025-10-29 | 2026-03-27 | — in progress | -24.23 % | 157 |
| 2023-02-03 | 2023-03-13 | 2023-06-15 | -18.62 % | 92 |
| 2023-07-05 | 2023-10-03 | 2023-11-14 | -18.00 % | 94 |
| 2024-12-09 | 2025-05-28 | 2025-09-11 | -17.82 % | 189 |
| 2024-07-17 | 2024-11-04 | 2024-12-02 | -16.13 % | 97 |

| Top_Switch | TLT | VNQ | UUP | EFA | DBC | GLD | DAX | SPY | |
|---|---|---|---|---|---|---|---|---|---|
| Annualized Return | 15.9% | -0.4% | 9.1% | 4.2% | 17.4% | 8.2% | 26.3% | 17.5% | 22.1% |
| Annualized Std Dev | 24.3% | 14.3% | 17.2% | 6.7% | 14.9% | 16.2% | 19.4% | 15.0% | 14.9% |
| Annualized Sharpe | 0.65 | -0.02 | 0.53 | 0.62 | 1.17 | 0.51 | 1.35 | 1.17 | 1.48 |
| Worst Drawdown | 24.2% | 22.4% | 21.8% | 10.1% | 14.1% | 13.8% | 24.5% | 16.0% | 18.8% |


| Top_Switch | TLT | VNQ | UUP | EFA | DBC | GLD | SPY | DAX | |
|---|---|---|---|---|---|---|---|---|---|
| Annualized Return | 25.9% | 1.4% | 7.4% | 3.5% | 6.5% | 2.2% | 9.9% | 13.4% | 7.6% |
| Annualized Std Dev | 21.7% | 14.4% | 19.5% | 7.0% | 16.8% | 17.3% | 15.7% | 17.0% | 18.7% |
| Annualized Sharpe | 1.20 | 0.09 | 0.38 | 0.50 | 0.39 | 0.13 | 0.63 | 0.79 | 0.41 |
| Worst Drawdown | 24.2% | 48.4% | 42.4% | 14.2% | 34.2% | 59.9% | 24.5% | 33.7% | 38.8% |
| Jan | Feb | Mar | Apr | May | Jun | Jul | Aug | Sep | Oct | Nov | Dec | Year | |
|---|---|---|---|---|---|---|---|---|---|---|---|---|---|
| 2014 | |||||||||||||
| 2015 | |||||||||||||
| 2016 | |||||||||||||
| 2017 | |||||||||||||
| 2018 | |||||||||||||
| 2019 | |||||||||||||
| 2020 | |||||||||||||
| 2021 | |||||||||||||
| 2022 | |||||||||||||
| 2023 | |||||||||||||
| 2024 | |||||||||||||
| 2025 | |||||||||||||
| 2026 |

My portfolio comprises:
- Top_Dual & Top_Target momentum and accumulation strategies, are focusing on harnessing and leveraging market trends for consistent and sustainable growth.
- Top_Switch, an Asset rotation strategy is dynamically reallocating capital across asset classes to optimize returns and mitigate risks.
- Top_Vola strategy, is tailored to capitalize on both sudden and sustained market fluctuations, enhancing risk - adjusted returns.
- Top_Rank, a systematic ranking strategy that continuously allocates capital to the strongest-performing assets, ensuring disciplined participation in prevailing market leadership.
- Top_Trend (=CTA) strategy, which forms the backbone of diversification with a 30 % allocation. This strategy excels in capturing trends and providing stability during market
- Additional advanced and highly specialized approaches, crafted to adapt seamlessly to complex and evolving market dynamics.
Together, these strategies create a robust and well - balanced portfolio framework. By blending simplicity with sophistication, the approach ensures adaptability, consistency, and long - term success, even in the face of unpredictable market conditions.
Uncorrelated Strategies
The cornerstone of success lies in the deliberate and precise integration of diverse, genuinely uncorrelated strategies, executed with unwavering discipline and emotional composure. My approach is devoid of the influence of greed or fear, guided instead by the principles of expertise and professionalism. Each decision is the product of meticulous analysis and a technically sound methodology, consciously avoiding impulsive or reactionary behavior. Furthermore, all decisions are grounded 100% in mathematical and statistical principles, ensuring objectivity and consistency. By consciously excluding any human influence, the process eliminates the risk of emotional bias or subjective judgment. This steadfast adherence to strategy allows me to navigate the complexities of the markets with confidence and consistency, maintaining an unyielding commitment to excellence.
Trading
The elegance of these strategies lies in their straightforward yet effective design. Each morning, data is carefully downloaded, and within 15 minutes, calculations ensure that theoretical models align seamlessly with practical execution. By evening, new orders are automatically dispatched to the exchange, just before the market closes. This approach is not a feat of magic, but rather a testament to disciplined craftsmanship. It guarantees that execution timing remains uninfluenced — an essential factor in maintaining the robustness and reliability of the strategy.
Data Used
Back-testing is often dismissed as mere theory or abstract mathematics. However, I recognize that the performance up to December 2022 reflects a combination of real - time trading outcomes and newly implemented systems. While historical achievements provide valuable insights, I find little satisfaction in endlessly revisiting past successes. My focus is clear and uncompromising—cutting through bureaucracy to channel my energy toward the present and future, where true progress is made.
Dedication
In collaboration with my dear friend and developer, Helmuth Vollmeier, in a fit of genius or maybe just sheer madness, we decided to hit the reset button on everything in 2022. It was like a software update for our lives — new and improved. Unfortunately, the joy of our new start was short-lived as Helmuth passed away suddenly in February 2023, leaving me deeply saddened. Despite facing phases of doubt and questioning the meaning of it all, I returned to my desk, immersing myself in learning once again, now without my dear friend Helmuth by my side! I dedicate this work to Helmuth Vollmeier, one of my best friends, my intellectual partner, my daily communicator, and companion!
Top Dual ✓ Top Switch Top Target Top Rank Top Vola Top Trend